Photo by stock.adobe.com
A Restricted SIR Model with Vaccination Effect for the Epidemic Outbreaks Concerning COVID-19 - Agent-Based Modeling
An agent-based model for the epidemic outbreaks concerning COVID-19. he new model focuses on two main concepts: first, it can present multiple waves of the disease, and second, it analyzes how far an infection can be eradicated with the help of vaccination.


Introduction
The COVID-19 virus, first identified in Wuhan, China in December 2019, was declared a global pandemic by the World Health Organization (WHO) on March 11, 2020. Research on coronaviruses dates back to 1965, highlighting the respiratory nature of the B814 virus and its potential for human transmission.
This pandemic underscores the critical role of vaccinations, informed by historical successes against infectious diseases. Modern strategies include rigorous epidemiological modeling, such as the SIR (Susceptible, Infectious, Removed) model, initially applied during London's Black Death by Kermack and McKendrick, which segments the population based on disease exposure and recovery statuses.
Recent enhancements to the SIR model incorporate network theory and varying infection dynamics, allowing for nuanced understanding and effective disease control strategies. These models prioritize timely interventions, like vaccination and isolation, to mitigate disease spread, supported by both theoretical and computational studies.
Such mathematical frameworks are not only pivotal for managing current epidemics like COVID-19 but also for planning future public health responses.
Theoretical Basis
The agent-based model presented here is an extension of the SIR model, and based on the article "A Restricted SIR Model with Vaccination Effect for the Epidemic Outbreaks Concerning COVID-19" by Ibtehal Alazman, Kholoud Saad Albalawi, Pranay Goswami2, and Kuldeep Malik. The new model focuses on two main concepts: first, it can present multiple waves of the disease, and second, it analyzes how far an infection can be eradicated with the help of vaccination.
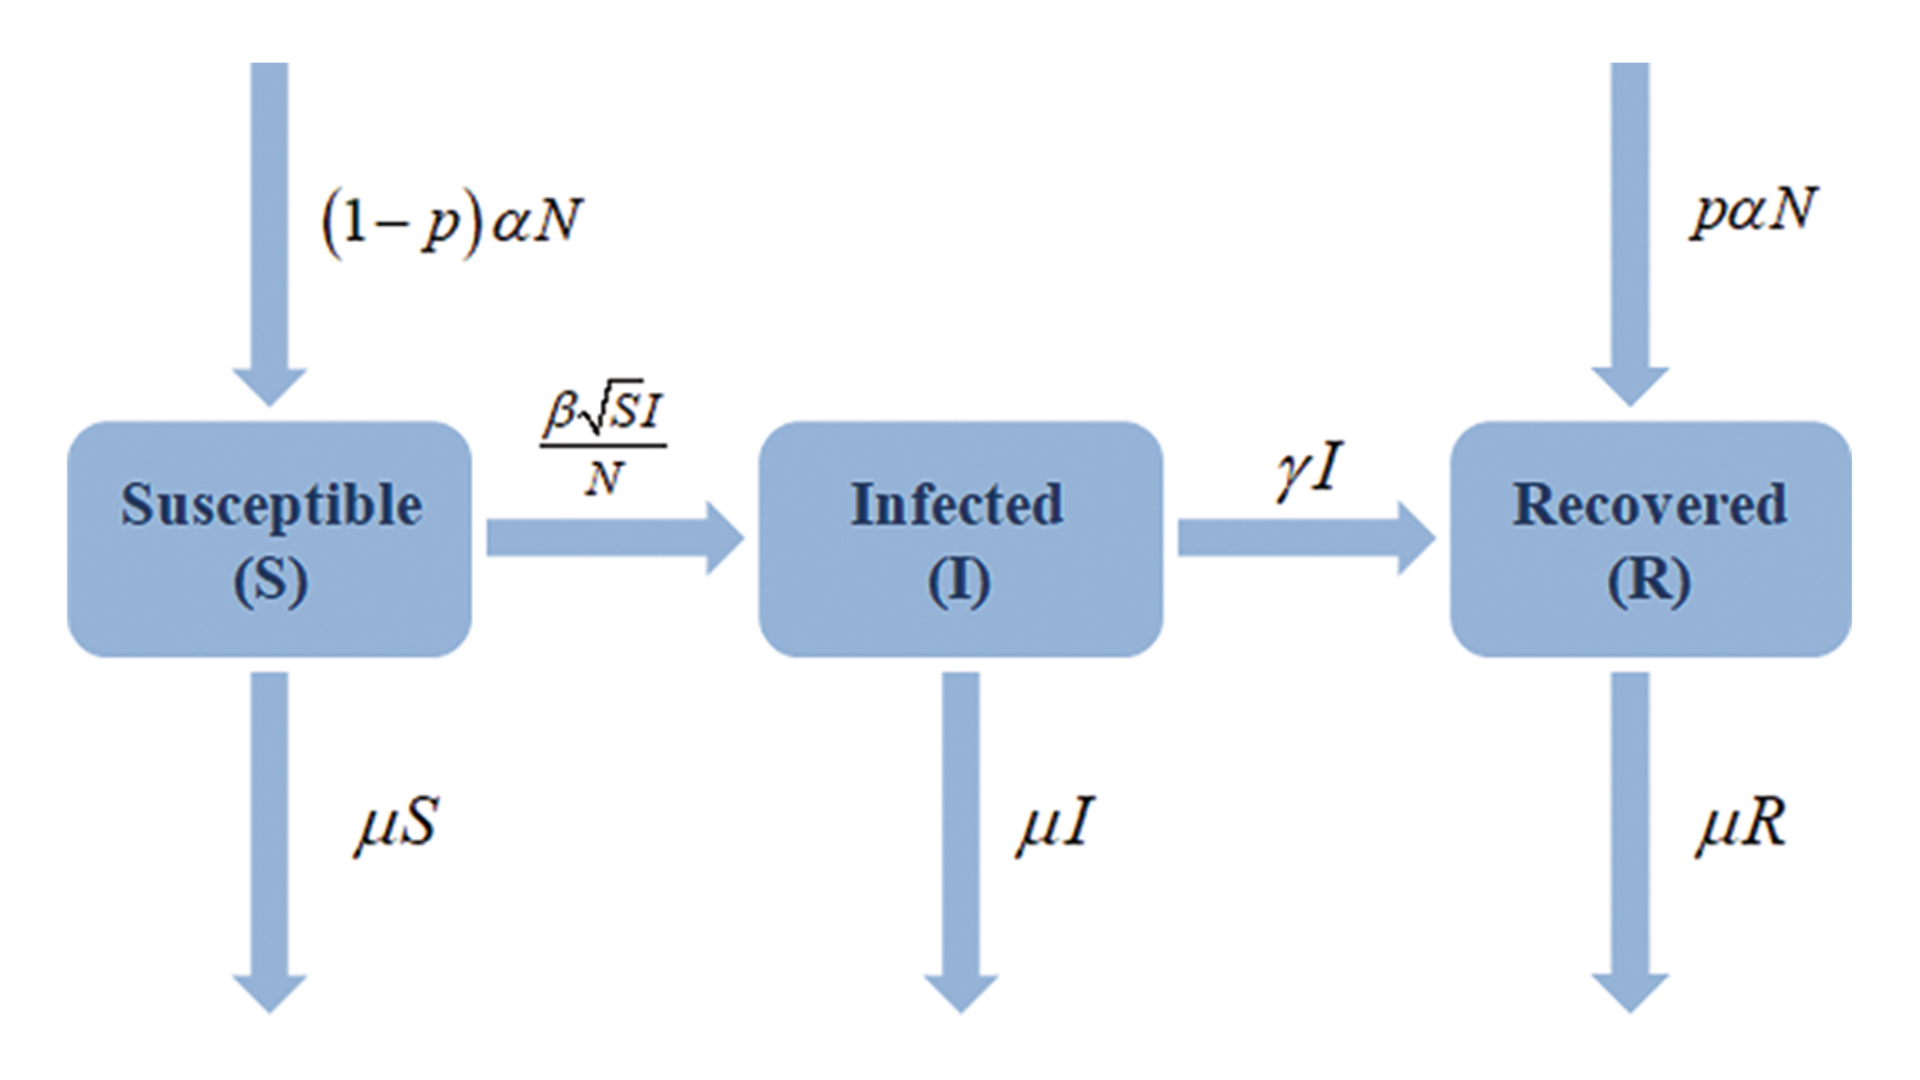
Now we have an entirely new equation,
Where:
-
dS/dt - Susceptible over time
-
dI/dt- Infected person over time
-
dR/dt- Recovered over time
-
Vaccination Rate(p) - total percentage of population that are vaccinated
-
Infection Rate(β) - the spread rate of the disease
-
Birth Rate(α) - the birth rate of the population
-
Death Rate(μ) - the death rate of the population
-
Recovery Rate(γ) - the recovery rate of a person from the disease
-
Population(N) - The number of population
Assumptions:
- All vaccinated persons are immune to the disease
- All recovered individuals and not vaccinated individuals are susceptible to the disease
Netlogo Embedded Simulation
Code Snippets and its Explanation
Here are some code snippets and their explanation
Setup
The setup procedure is used to initialize the simulation. It clears all the turtles and creates the initial population of turtles. The turtles are then placed at random coordinates on the grid. The shape of the turtle is set to "person", the status is set to "S" (susceptible), the infectious time is set to 0, and the start of susceptibility is set to 0. One of the turtles is then selected randomly and its status is set to "I" (infectious). The update_display procedure is then called to update the display. The reset-ticks procedure is then called to reset the ticks.
to setup
  clear-all

  create-turtles initial_population [
    setxy random-xcor random-ycor
    set shape "person"
    set status "S"
    set infectious_time 0
    set start_of_susceptability 0
  ]

  ask one-of turtles [set status "I"]

  update_display

  reset-ticks
end
Go (Main Procedure)
The go procedure is the main procedure that is called at each tick of the simulation. It checks if there are any infectious turtles left, and if not, the simulation stops. It then updates the variables and status of each turtle, moves the turtles, spreads the infection, recovers or dies, checks if the turtle should become susceptible again, and gets vaccinated. It then handles the birth rate and death rate, updates the display, and updates the variables. Finally, it increments the tick.
to go
  if all? turtles [status != "I"] [stop] ;; stop if no infectious turtles left

  ask turtles [
    update_turtle_variables ;; update the variables of the turtle (infectious time, start of susceptibility)
    move
    if status = "I" [
      spread
      recover_or_die
    ]
    be_susceptible ;; check if the turtle should become susceptible again
    get_vaccine
  ]

  handle_birth_rate
  handle_death_rate

  update_display ;; update the display (colors)
  update_variables ;; update the variables (counts, rates)

  tick
end
Spread of Infection
We have a variable input infection_rate which is used to calculate the infection rate. We then ask the turtle to check if the random float is less than the infection rate. If it is, the status of the turtle is set to "I".
to spread
  ask other turtles in-radius 1 with [status = "S"] [
    if random-float 100 < infection_rate [
      set status "I"
    ]
  ]
end
Recovery or Death (COVID-19 Specific)
We have a variable input recovery_rate which is used to calculate the recovery rate. We then ask the turtle to check if the random float is less than the recovery rate. If it is, the status of the turtle is set to "R".
to recover_or_die
  if infectious_time > days_until_death [
    set status "D"
    set died_from_covid_count died_from_covid_count + 1
  ]

  if status != "D" and infectious_time > days_to_be_recoverable [
    if random-float 100 < recovery_rate [
      set status "R"
      set infectious_time 0
      set start_of_susceptability days_to_be_susceptible
    ]
  ]
end
Get Vaccine
We have a variable input vaccination_rate which is used to calculate the vaccination rate. We then ask the turtle to check if the random float is less than the vaccination rate. If it is, the status of the turtle is set to "V".
to get_vaccine
  ;; Delay Vaccination
  if ticks > start_of_vaccination * 7 [
    if status != "I" and status != "D" [
      let current_vaccination_percentage (count turtles with [status = "V"] / count turtles) * 100

      if current_vaccination_percentage < vaccination_rate [

        if random-float 100 < (vaccination_rate - current_vaccination_percentage) [
          set status "V"
          set infectious_time 0
        ]
      ]
    ]
  ]
end
Birth Rate
We have a variable input annual_birth_per_1000 which is used to calculate the birth rate. The birth rate is calculated by multiplying the number of turtles with the birth rate per 1000 per year and dividing it by 1000. The rate is then calculated by dividing the product by 365. We then ask one of the turtles to check if the random float is less than the rate. If it is, the status of the turtle is set to "S" and the birth count is incremented by 1.
to handle_birth_rate
  let rate (count turtles * (annual_birth_per_1000 / 1000)) / 365

  ifelse random-float 100.0 < rate
  [
    set birth_count birth_count + 1
    create-turtles 1
    [
      setxy random-xcor random-ycor
      set shape "person"
      set status "S"
    ]
  ]
  []
end
Death Rate (Natural)
We have a variable input annual_death_per_1000 which is used to calculate the death rate. The death rate is calculated by multiplying the number of turtles with the death rate per 1000 per year and dividing it by 1000. The rate is then calculated by dividing the product by 365. We then ask one of the turtles to check if the random float is less than the rate. If it is, the status of the turtle is set to "D" and the natural death count is incremented by 1.
to handle_death_rate
  let rate (count turtles * (annual_death_per_1000 / 1000)) / 365

  ask one-of turtles [
    if random-float 100.0 < rate
    [
      set status "D"
      set natural_death_count natural_death_count + 1
    ]
  ]
end
Update Turtle Variables
The update_turtle_variables procedure is used to update the variables of the turtle. The infectious_time is incremented by 1, and the start_of_susceptability is decremented by 1.
to update_turtle_variables
  if status = "I" [
    set infectious_time infectious_time + 1
  ]
  if status = "R" [
    set start_of_susceptability start_of_susceptability - 1
  ]
end
Be Susceptible
The be_susceptible procedure is used to check if the turtle should become susceptible again. If the start_of_susceptability is less than or equal to 0, the status of the turtle is set to "S".
to be_susceptible
  if status = "R" and start_of_susceptability < 1 [
    set status "S"
    set start_of_susceptability 0
  ]
end
Update Display
The update_display procedure is used to update the display. It sets the color of the turtles based on their status.
to update_display
  ask turtles [
    ifelse status = "I" [ set color red ] [ set color yellow ]
    if status = "R" [ set color green ]
    if status = "V" [ set color blue ]
    if status = "D" [ set color violet ]
  ]
end
Update Variables
The update_variables procedure is used to update the variables. It calculates the total number of turtles, the number of susceptible, infectious, recovered, vaccinated, and dead turtles, and the birth and death rates.
to update_variables
  set total_count count turtles
  set infected_count count turtles with [status = "I"]
  set vaccinated_count count turtles with [status = "V"]

  set current_infection_rate count turtles with [status = "I"] / count turtles * 100
  if current_infection_rate > peak_infection_rate [
    set peak_infection_rate current_infection_rate
    set multi_peak_count multi_peak_count + 1
  ]
end
Explanation of Test Settings
The default values for input parameters are based on a research paper that inspired this model. For example, the infection_rate is set at 0.45, the recovery_rate at 0.265, the natural death rate at 6.5 per 1000 per year (annual_death_per_1000), and the birth rate at 19 per 1000 per year (annual_birth_per_1000), which are based on the average values for the Philippines in 2020, according to Wikipedia. The days_until_death is set at 24, days_to_be_recoverable at 4, and days_to_be_susceptible at 2. The initial_population is set at 2000. The vaccination_rate is variable, allowing us to observe the effect of vaccination on the disease's spread. The start_of_vaccination is set at 6 weeks to observe the peak of the first wave of the disease before the vaccination program starts, facilitating accurate comparisons to the previous research or model basis.
The different model parameters used in the simulation are described below:
initial_population(N): The initial population at the start of the simulation.infection_rate: The rate at which the disease spreads from an infectious person to a susceptible person.recovery_rate: The rate at which an infectious person recovers from the disease.vaccination_rate: The rate at which people are vaccinated against the disease.days_to_be_recoverable: The number of days until an infectious person is considered recoverable.days_to_be_susceptible: The number of days until a recovered person becomes susceptible again.days_until_death: The number of days until an infectious person dies from the disease.annual_birth_per_1000: The annual birth rate per 1000 people.annual_death_per_1000: The annual death rate per 1000 people.start_of_vaccination: The day when the vaccination program starts.
Results and Discussion
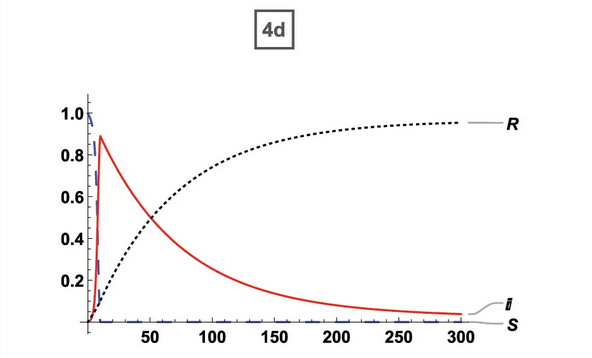
| Original Paper | ABM Version |
|---|---|
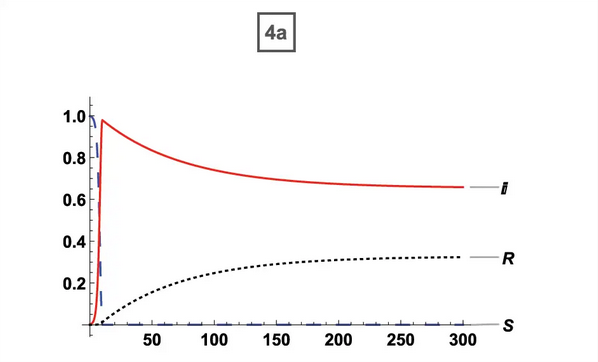 0% Vaccination (ORIG) 0% Vaccination (ORIG) | 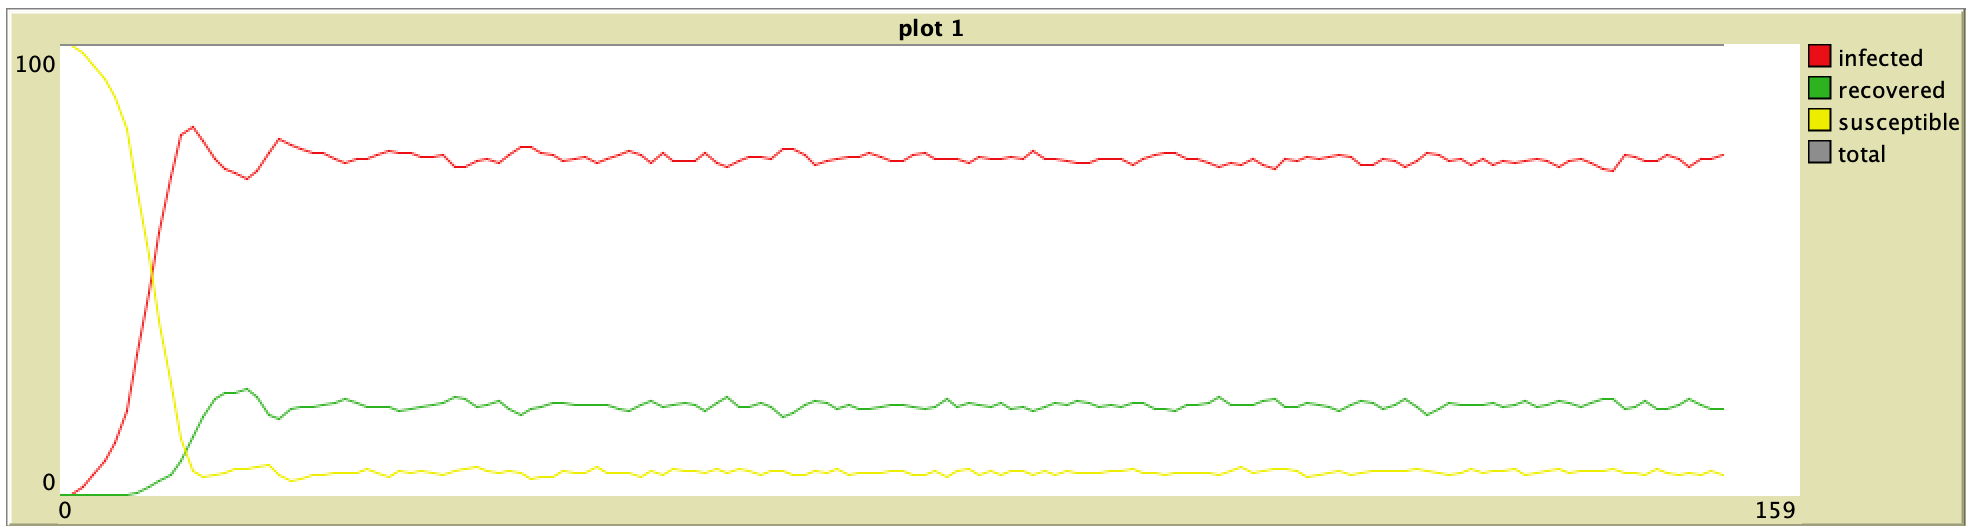 0% Vaccination (ABM) 0% Vaccination (ABM) |
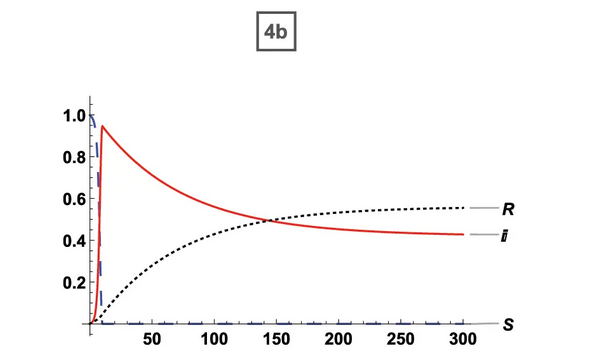 35% Vaccination (ORIG) 35% Vaccination (ORIG) | 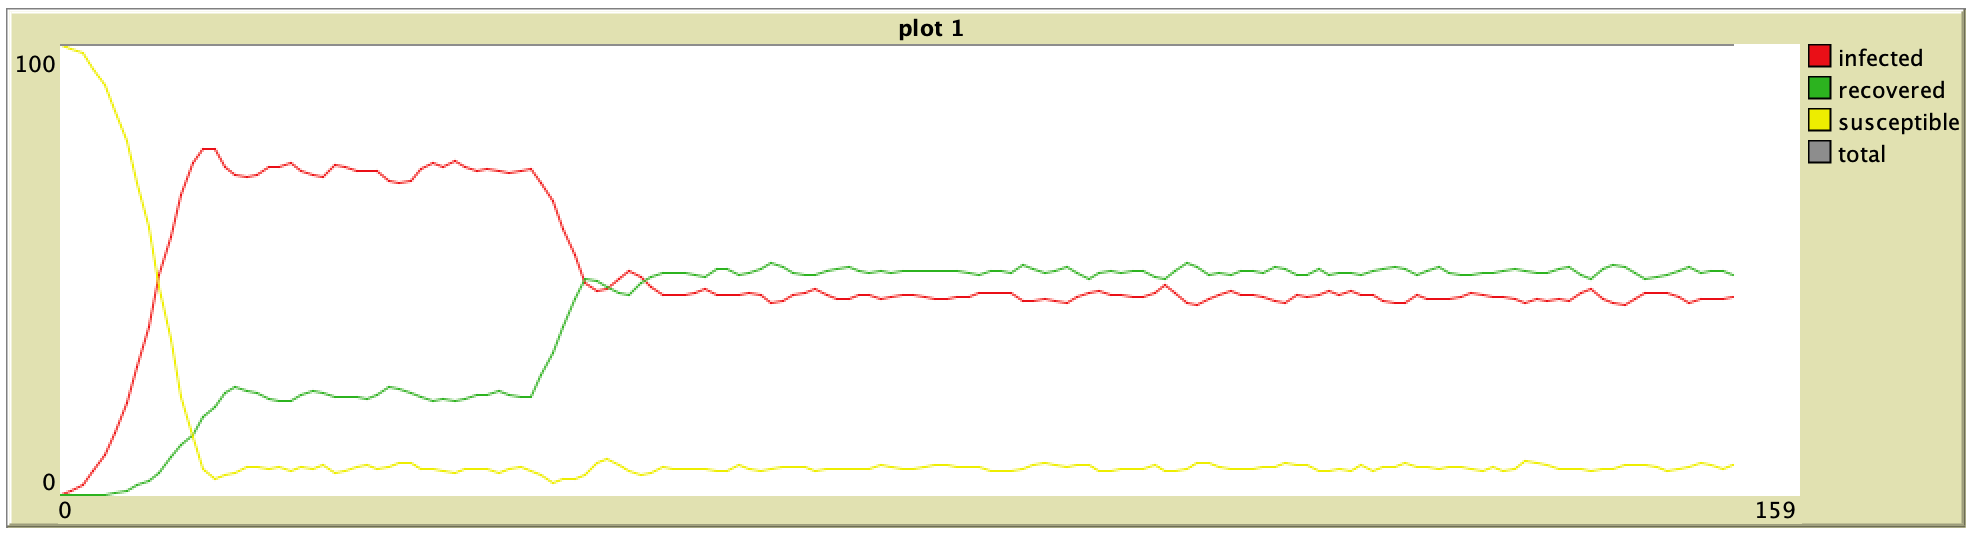 35% Vaccination (ABM) 35% Vaccination (ABM) |
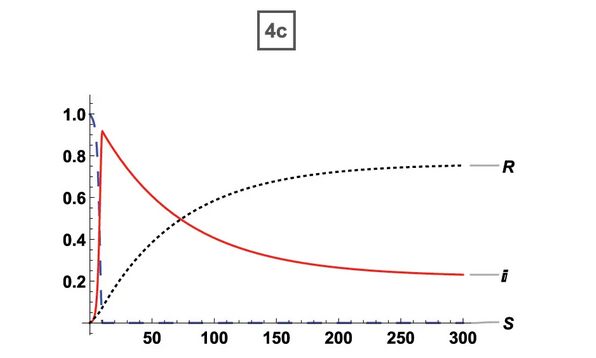 65% Vaccination (ORIG) 65% Vaccination (ORIG) | 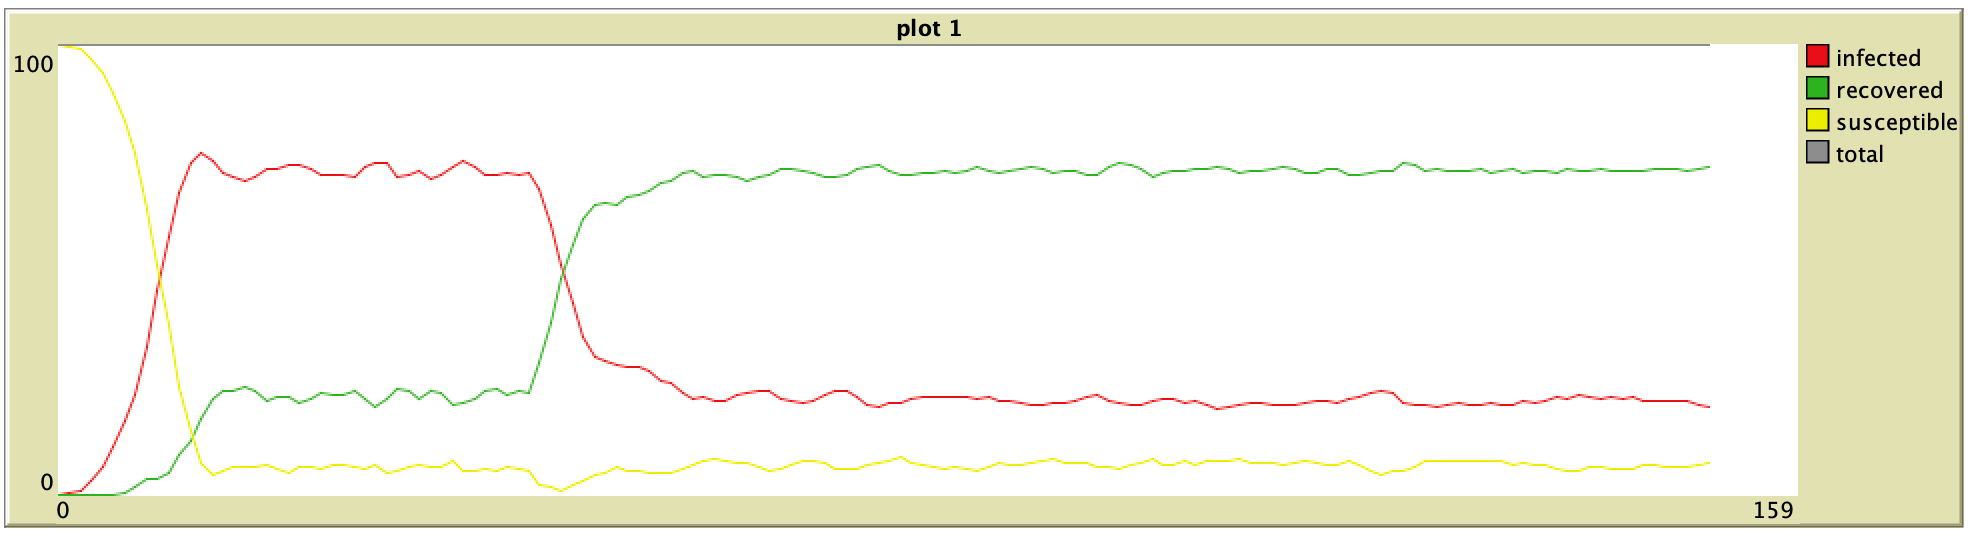 65% Vaccination (ABM) 65% Vaccination (ABM) |
 95% Vaccination (ORIG) 95% Vaccination (ORIG) | 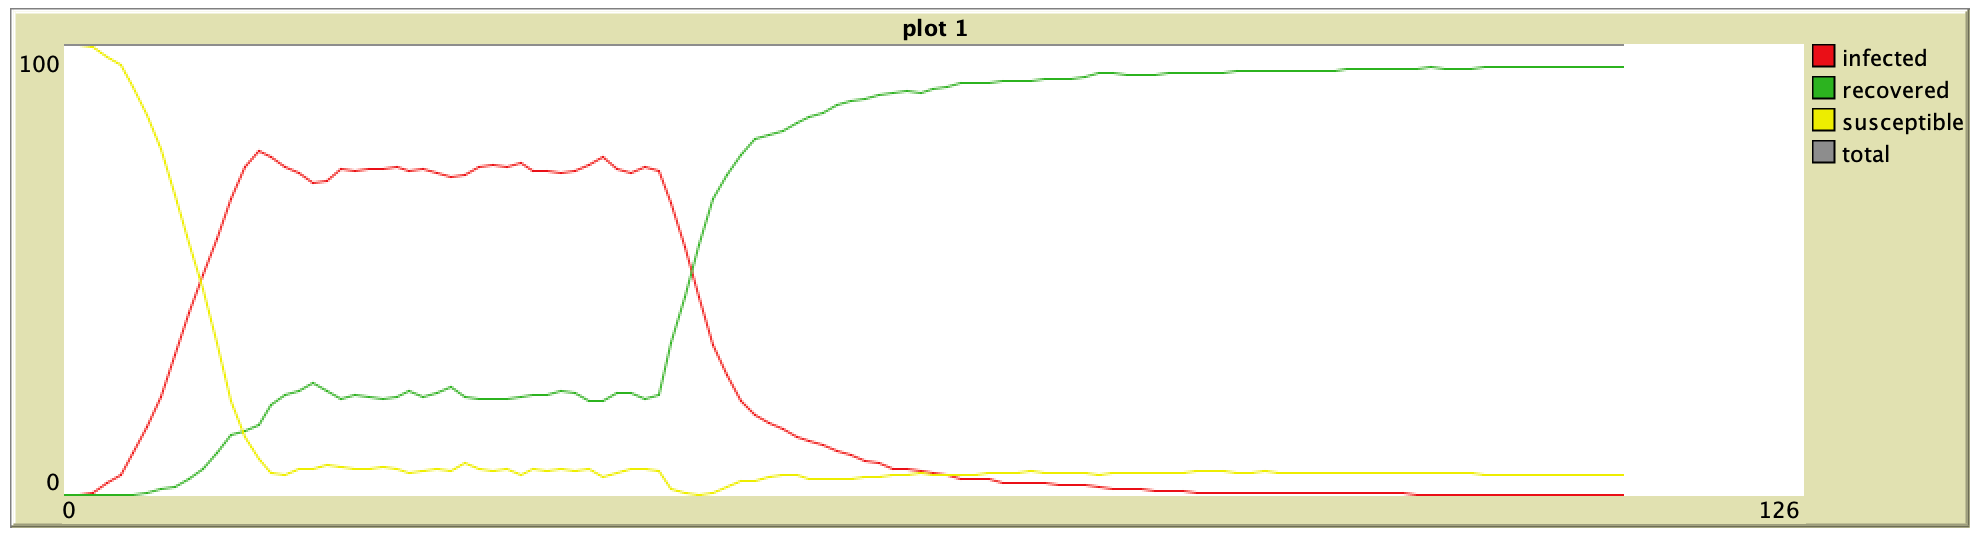 95% Vaccination (ABM) 95% Vaccination (ABM) |
Key Takeaways
- We've expanded the traditional SIR model into an agent-based model that captures the dynamics of multiple disease waves and the effects of vaccination strategies.
- This model effectively simulates the transmission of COVID-19 and evaluates how vaccination contributes to the containment and potential eradication of the disease.
- It serves as a powerful tool for assessing the efficacy of vaccination drives and other public health measures aimed at curbing the spread of infectious diseases.
- Implementing vaccination programs is identified as a proactive and impactful method for mitigating the impact of infectious disease outbreaks.
- There are really difference between equation-based, agent-based modelling and reality. They may have differences but they gave us insights to what will happen
References
Alazman, I., Albalawi, K. S., Goswami, P., & Malik, K. (2023). A Restricted SIR Model with Vaccination Effect for the Epidemic Outbreaks Concerning COVID-19. Computer Modeling in Engineering & Sciences, 137(3), 2410-2421. https://doi.org/10.32604/cmes.2023.028674